
It's a fact that not every marketer monitors their Google Ads the same way and it's understandable that everyone has a different success formula to skyrocket their clients' results. In this article, we are going to talk about our way of monitoring Google Ads and how we manage to keep performance top-level.
What is Google Data Studio?
First things first, Google Data Studio is a way of visualising data from over 100 sources with the help of custom or ready-to-use shareable templates. As Google would say, it is a way to "tell a story with your data."
The beauty of this tool is that you can share these dashboards with your team or clients, which means that they can see real-time data and interact with them, something which is translated to transparency and full monitoring.
Let's take a look at some of these dashboards...
1. Campaigns Performance Analysis
The first dashboard we are going to present is the Google Ads Overview Template which you can find in the Data Studio template gallery. The only thing you need to do is to connect your data source and start analysing your results.
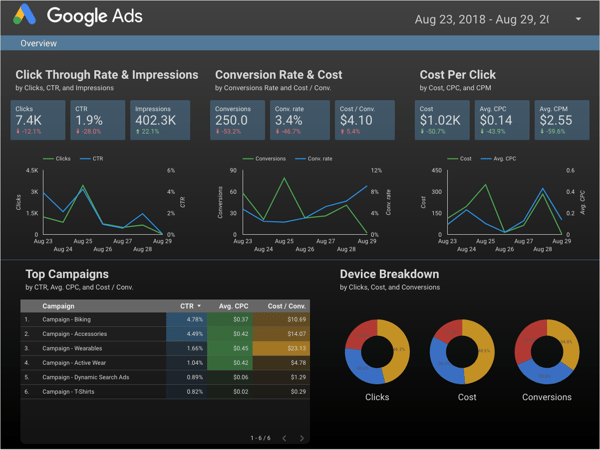
Starting from the top left corner of the dashboard, you can see the average Click Through Rate, the number of Impressions, and the number of Clicks of your campaigns. This is more of a Delivery Status report that one should take into consideration before starting to analyse anything else. With the help of the graph, you can check if there was a significant change during the selected time period and identify trends or issues if there's a continuous drop in the results.
Moving right you can see more performance-related stats like Numbers of Conversions, Conversion Rate and Cost per Conversion. This is extremely important if you are working with specific goals and what matters to you most is Conversion flow.
In the top right corner, you can see results related to the actual spend of your campaigns, like the average Cost per Click, the amount you are spending, and how much it costs you for every 1,000 impressions you receive.
Moving forward, on the bottom left, you can see a breakdown of your campaigns on a customisable table. In the image above, we can see that CTR, Avg. CPC and Cost/Conversion are selected, but you can change these based on your campaign's objectives.
Finally, in the bottom right corner, there is a device breakdown to help you identify the best performing devices based on the metrics of your choice. If you are on PPC, I am sure you know the importance of device adjustments!
2. Budget Monitoring
The previous template was a "plug-and-play" dashboard mostly for quick account overviews which you can use internally or send to your clients for transparency.
The template below is something we created and are using internally to monitor our clients' budgets and make sure that we’re not overspending or underspending.
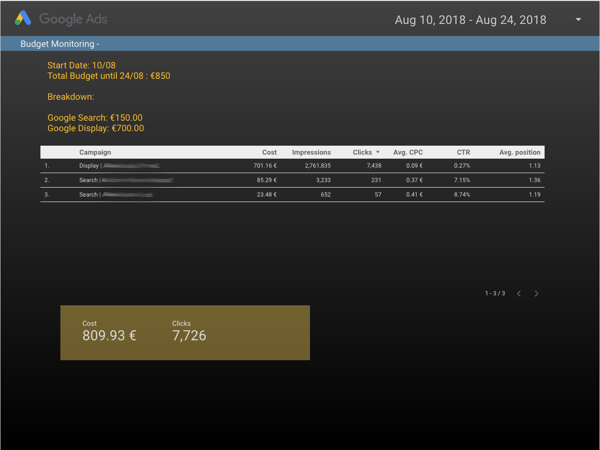
What we wanted to achieve with this simple template was to have our brief and spending all in one place, and so far it seems that we’re smashing it! This is all you need to create the Budget Monitoring template:
- Insert some text boxes for your Start and End Date, as well for the agreed budget.
- Insert a table with your campaign breakdown.
- Insert a few scorecards to get Total Results.
- Add the Date Range module.
For easier access, you can always bookmark your dashboards and organise them in a folder.
3. Advanced Budget Monitoring
Let's say that you want to monitor multiple accounts budgets in real time, all in one place. No worries, all you need to do is use your imagination and create some custom metrics! The end result might look a bit like this:
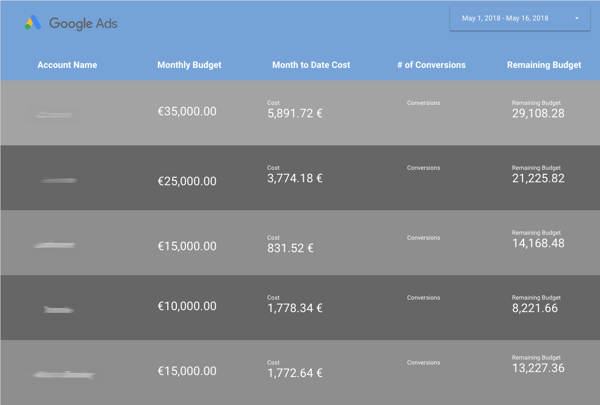
Starting with the first two columns, we just made use of some text boxes to type our Accounts' names and Monthly Budgets.
For the third column, we made use of Data Studio's Score Cards with the only difference in each column being the data source, highlighting the advantage of using different data sources in one reporting template.
Regarding the fourth column, we just wanted to monitor conversions as well, with the help of Score Cards. You can always scrap this column or use a metric that matters the most for your campaigns.
Finally, the last column is where the trick is. Data Studio cannot give you the Remaining Budget, so in that case you can make use of Custom Fields. All you need is to add a Score Card on your report, click to add metric and then scroll all the way down until you find "Create New Field" (image below).
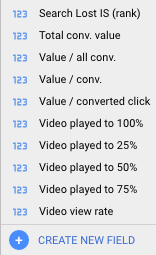
This will give you a blank input box where you can type your equation. We used: Monthly Budget (type your actual budget) - Cost (existing metric).
Your Turn Now!
We have seen that monitoring campaigns is not rocket science and can be a very easy process with the help of Data Studio. Whether you are looking for a performance report or budget monitoring for your team or clients, there is no need to look further.
If you found this post interesting, please leave your comment below and let us know what your best campaign monitoring practice is!